Linux S1E1: From Off-by-Null to Kernel Pointer Leaks
About a year ago, I remember watching a video series by LiveOverflow, a security researcher with a well-known Youtube channel, on him “getting into” browser exploitation [0]. Don’t ask me about any technical details, but what stuck with me is the way he describes how this video series came about; He reflects that he had been interested in the topic for quite a while, regularly annoying experienced researcher with the typical beginner question: “How do I get into it?”, but always just shying away from actually committing to leaning about it - thinking that the topic was too complex, the entry barrier to high.
No clue if that is really what he said in the video, but it is what stuck with me, probably since it was echoing some thoughts of my own; What was browser exploitation for him, was kernel exploitation for me. So, this three-part series is the answer I finally gave to my question “How to get into kernel exploitation?”; Just start somewhere, do not wait for the perfect time, just start - the rest you will pick up along the way.
These posts document how I got started with kernel exploitation. They are written by a beginner for beginners. On the upside this might imply that they provide a resource more accessible than the, often pretty brief, writeups by experienced researchers that gloss over many of the pitfalls that we get caught in. On the downside, however, it means you should take everything I say with a grain of salt. If you spot mistakes, do not hesitate to let me know.
Where to Start?
LiveOverflow started by analyzing an exploit by a fellow security researcher for a vulnerability that researcher discovered in the SpiderMonkey JavaScript engine. I had no clue where to start, and more or less by chance ended up with a CTF challenge that I read about recently.
Last year’s CorCTF [2] featured the CorJail [3] challenge, which, if I recall correctly, was only solved by a member of the organizing team. I started by carefully reading the writeup [4] by the challenge author and then got to work.
The Single Most Important Thing
Of course, we will conclude this series with a section on learnings and reflections, however, let me spoiler the most important one up front: get yourself a proper debugging setup.
Luckily for us, the challenge repository contains the kernel configuration and patches used for building the image, and thus I started by recompiling the kernel with all the debugging features I wanted. Then I proceeded with building the root filesystem, modifying it to give myself regular root access before launching the unprivileged shell from which we eventually want to elevate our privileges back again.
Next let us turn to the vulnerable kernel module. Since source code was available, recompiling it with debug information would have been an option, however, it loaded without problems, and we will not spend much time in there anyway.
Finally, we need a way to debug the kernel. I used my fork of the fabulous like-dbg [5] setup, which is a great platform for building your personal kernel debugging and exploit development environment. Importantly, we also need a way to run custom gdb scripts, which can be easily archived using this setup.
With scripts, symbols and source code debugging in place, let us go ahead and dissect the vulnerable kernel module.
Aside: You can find a release of the setup on GitHub [6]. You might want to use it together with the exploit [7] to follow along with the series.
Exploring the Challenge
Like many other kernel CTF challenges, the rootfs contains a custom kernel module that is loaded on boot. However, I like that it is not just some toy driver whose only purpose is to be exploited; The author actually took a kernel patch that was proposed on the mailing list and split it up into a change to the core kernel and a stand-alone module.
In particular, the kernel patch implements per-cpu syscall counters, and the kernel module exposes them to user space via a file in procfs. We can display the counters by reading from the file and filter the shown system calls by writing to it.
root@CoROS:~1 cat /proc/cormon

      CPU0      CPU1      CPU2      CPU3        Syscall (NR)

        15        12        26         8        sys_poll (7)
         0         0         0         0        sys_fork (57)
        47        51        71        66        sys_execve (59)
         0         0         0         0        sys_msgget (68)
         0         0         0         0        sys_msgsnd (69)
         0         0         0         0        sys_msgrcv (70)
         0         0         0         0        sys_ptrace (101)
        14         4        19         9        sys_setxattr (188)
        11        23        17        25        sys_keyctl (250)
         0         0         2         0        sys_unshare (272)
         0         0         0         0        sys_execveat (322)

root@CoROS:~2 echo -n 'sys_pipe' > /proc/cormon
[   57.315786] [CoRMon::Debug] Syscalls @ 0xffff888104681000
root@CoROS:~3 cat /proc/cormon

      CPU0      CPU1      CPU2      CPU3        Syscall (NR)

         3        13         3         2        sys_pipe (22)
There are few standardized places where auto loaded drivers should be specified, and we find the cormon driver in /etc/modules. Loading it into BinaryNinja, we can confirm that on load this module creates a file in the proc pseudo file system {1}.
0000049f  uint64_t init_module()

000004a7      printk(0x668)
000004cc      int32_t rbx
000004cc      if (proc_create(0x5a3, 0x1b6, 0, 0x750) == 0)  {"cormon"} // {1}
000004d5          printk(0x698) // [CoRMon::Error] proc_create() call failed!
000004da          rbx = -0xc
000004ea      else
000004ea          int32_t rax_2 = update_filter(buffer: "sys_execve,sys_execveat,sys_fork…")
000004ef          rbx = rax_2
000004f3          if (rax_2 != 0)
00000503              rbx = -0x16
000004fc          else
000004fc              printk(0x6c8) // [CoRMon::Init] Initialization complete!
000004e2      return zx.q(rbx)
The fourth argument of the call to proc_create specifies which functions the kernel will invoke when user space interacts with the file.
00000750  cormon_proc_ops:
00000750  00 00 00 00 00 00 00 00                          ........

00000758  void* data_758 = cormon_proc_open
00000760  void* data_760 = seq_read

00000768                          00 00 00 00 00 00 00 00          ........

00000770  void* data_770 = cormon_proc_write
The bug is in the write handler cormon_proc_write.
00000384  int64_t cormon_proc_write(int64_t filp, int64_t buf, int64_t len, int64_t* ppos)
...
000003b6      if (len u> 0x1000) // {2}
00000449          bytes_to_copy = 0xfff // {3.1}
000003bc      else
000003bc          bytes_to_copy = len // {3.2}
000003d6      char* buffer = kmem_cache_alloc_trace(*(kmalloc_caches + 0x60), 0xa20, 0x1000) // {4}
...
0000040f              __check_object_size(buffer, bytes_to_copy, 0)
0000041d              bytes_not_copied = _copy_from_user(buffer, buf, bytes_to_copy) // {5}
00000425          if (bytes_not_copied != 0)
00000478              printk(0x630)
0000047d              err = -0xe
00000427          else
00000427              buffer[bytes_to_copy] = 0 // {6}
00000435              if (update_filter(buffer: buffer) != 0)
00000489                  kfree(buffer)
0000048e                  err = -0x16
0000043a              else
0000043a                  kfree(buffer)
0000043f                  err = len
00000448      return err
Here, len and buf are the arguments user space passed to the write system call. At {2} the function validates the length argument, however, there is an obvious inconsistency between the assignments {3.1} and {3.2} when the length is equal to 0x1000. A buffer of fixed size 0x1000 is allocated at {4} and filled with user data at {5}. No buffer overflows occur at this point as bytes_to_copy is guaranteed to be <= 0x1000. However, the code expects that the truncated user data might not be null-terminated, and an out-of-bounds write of the terminating null byte might occur at {6}.
Summarizing our findings, the primitive granted by the bug is a linear heap overflow of size one where the written data is always a zero byte. Given the fact that our vulnerability involved the heap, it is probably worth the wile to learn a bit about kernel’s memory allocation algorithm.
SLUB Cash Course
For most people interested in exploitation, the first memory allocator that they studied is probably the malloc implementation of glibc. It is a fundamental component of virtually all Linux user space applications and consequently, much research has gone into exploiting it and there is ample literature on the subject.
However, there are many other ways to implement an allocator for small chunks of memory. For example, Android recently switched to using the Scudo allocator, which was developed with a special focus on security [8] [9].
When you leave user space and enter kernel land, things change. First of all, as of this writing, you can still choose between three different allocators at compile time: SLAB, SLUB and SLOB. Luckily, during the 6.4 merge window, that is the 2-week period in a kernel development cycle where disruptive changes can be merged into the kernel, the death of SLOB was decided. Furthermore, the removal of the SLAB allocator is on the to-do list of memory management developers [10]. Our challenge’s kernel is using the SLUB allocator, which will hopefully become the only remaining allocator at some point in the future.
Nevertheless, as it is the case with most aspects of the kernel, its allocator can be extensively configured at compile-time. Some aspects may also be configured at boot or run-time. Our discussion will be tailored to the configuration of the challenge’s kernel and I will mention the relevant compile-time definitions along the way.
The first difference between glibc’s malloc and SLUB is that SLUB is a so-called slab-allocator. (Note to avoid confusion: The word slab-allocator refers to a particular design for building memory allocators, which is popular in operating system kernels [11]. A slab, on the other hand, is a particular component in this design that is not to be confused with SLAB, which is a Linux kernel implementation of a slab-allocator.)
The buffers handed out by such an allocator are taken from contiguous memory ranges (typically between one and sixteen pages in size), which are logically subdivided into fixed size slots. Those memory ranges are called slabs.
Each slab is part of exactly one so-called cache. A cache is nothing but a collection of slabs that all have the same slot size. Allocation requests are always (implicitly or explicitly) made against a specific cache, which might in turn create itself a fresh slab to serve the request.
Here’s my attempt at illustrating the above concepts in a drawing.
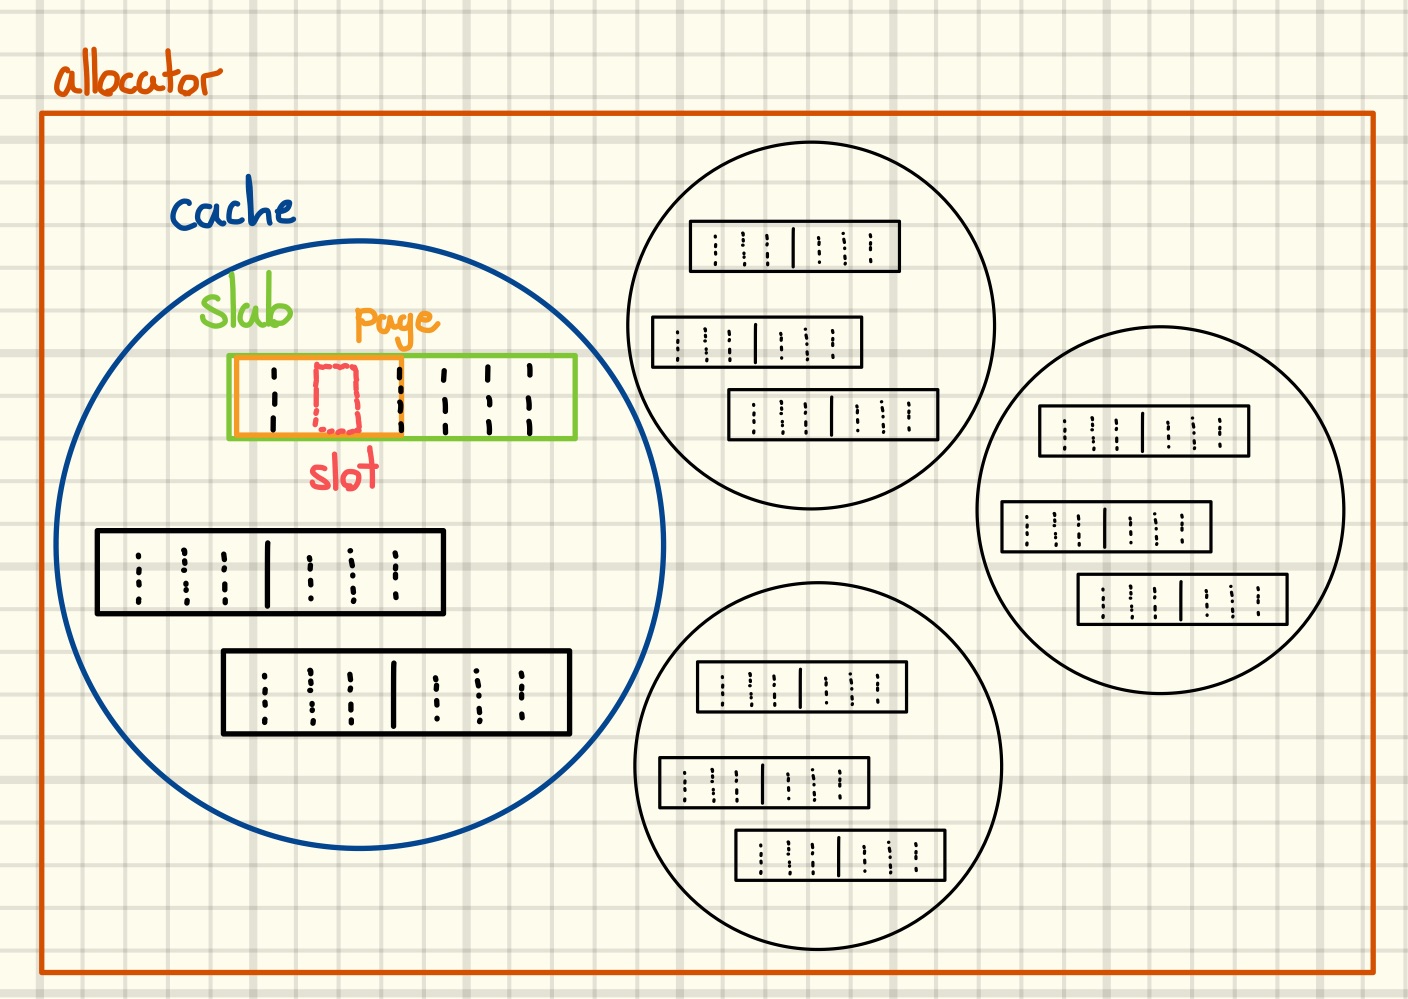
For example, in the Linux kernel there is the kmalloc family of caches. Those caches typically cover slot sizes from 32 to 8192 bytes and for each size there are multiple caches with different characteristics. When you read kernel code and see a call like
...
buf = kmalloc(size, GFP_KERNEL);
...
the allocation request will be directed towards a cache of the kmalloc family. However, be aware that when reverse engineering you will not see any calls to kmalloc in the disassembly because of compiler inlining. In the cormon_proc_write function, for example, the source code contains a call to kmalloc while the above listing shows a call to kmem_cache_alloc_trace.
Importantly for us, even same size allocation requests might be served from different caches when the second argument differs. Caches in the kmalloc family are also known as “general purpose” caches, as their buffers are used for many different kinds of objects by the kernel.
The other thing that you will frequently see are allocation requests that are explicitly directed towards a specific cache.
...
/* SLAB cache for sighand_struct structures (tsk->sighand) */
struct kmem_cache *sighand_cachep;
...
newsighand = kmem_cache_alloc(sighand_cachep, GFP_KERNEL);
...
Those caches often hold only objects of a specific type or are only used within a certain module.
The second difference has to do with the fact that the kernel is a highly parallel program with complete control over the hardware. While glibc’s malloc has many features to speed up memory allocations in multi-threaded programs by using per-thread data structures, the kernel is making heavy use of per-CPU data structures to improve the performance of the allocator implementation.
For each cache every logical CPU has its own private set of slabs for serving allocations. Among them, the slab that served the last allocation is the so-called CPU slab for that cache, all others are referred to as partial slabs. Note that the allocator does not track full slabs at all. It only becomes aware of them once one of their objects is freed.
What is more, in computing there is the concept of non-uniform memory access (NUMA) machines, where, while every CPU can access all physical memory, there is a certain region that is “fast” to access. Here, CPUs with the same “fast region“ form so-called NUMA-nodes. As another optimization, each node maintains its own set of per-node partial slabs for every cache.
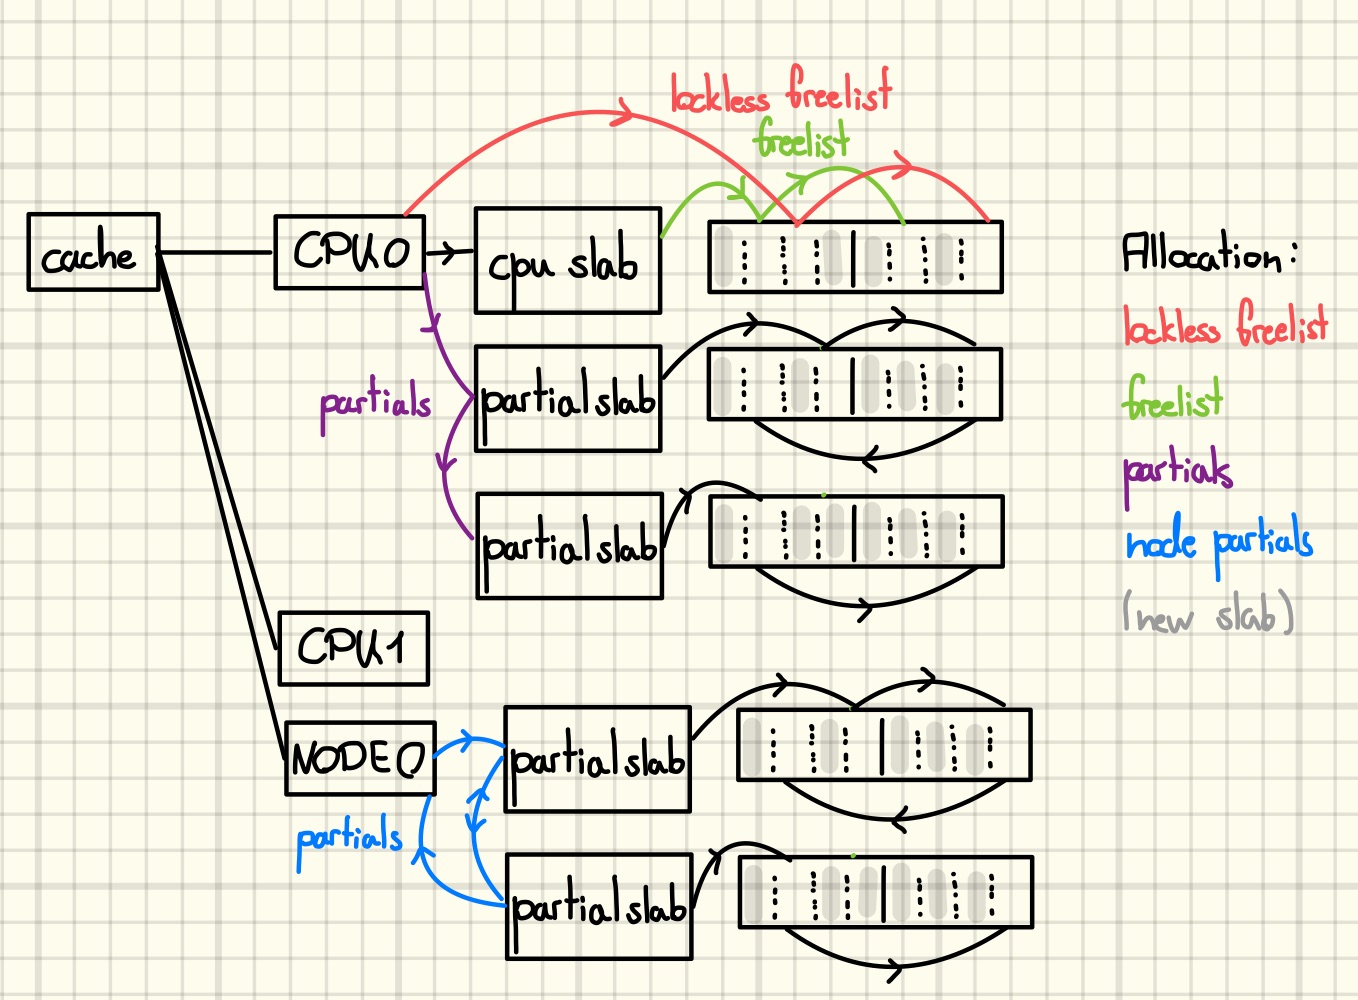
When severing an allocation request, the cache algorithm first checks the CPU slab. This slab has two freelists, a lockless freelist private to the owning CPU and the normal slab freelist, which might require locking. After checking those two, the partial slabs followed by the per-node partial slabs are consulted. On the way the algorithm opportunistically populates the empty lists from the currently checked one. If no existing slab is found, a new one is created and set as the CPU slab.
During a free operation, the slot is added to the freelist (LIFO) of the slab it belongs to. The only exception is freeing an object in a CPU slab on its owning CPU. In that case the slot goes to the lockless freelist. If the slab was previously full, then the CPU opportunistically adds it to its list of partial or per-node partial slabs. There’s one detail concerning a slab’s freelist worth mentioning at this point: for each slab the order in which its slots appear on its initial freelist is randomized during slab creation. Furthermore, freeing the last object in a partial slab might lead to its destruction if the CPU already has a sufficient number of empty slabs.
Here’s my attempt at illustrating the above concepts in a drawing.
Those are the core concepts of the SLUB allocator that are needed to understand the exploit and follow the decisions made. Some further aspects will be introduced along the way once we need them.
However, the topic is of course much richer, and I encourage you to have a look at one of the following references to dive deeper: [12], [13], [14]. After reading one or two of them, what helped me was having a look at the code in mm/slub.c and walking through allocations and frees in a debugger. It might also be instructive to have a look at gdb extensions that implement SLUB debugging [15] [16] (or writing your own) as well as special purpose debugging tools used by kernel developers [17]. At this point we will end our digression on SLUB internals and apply our newfound knowledge to solve the challenge at hand.
SLUB Exploitation Crash Course
In this section, we will discuss the implementation details described above from an exploitation perspective.
Generally, one can distinguish between exploitation techniques that target the heap implementation and those that target the data stored on the heap. We are going to be focusing on the latter.
First, the per-CPU design implies that we must carefully control on which CPU we trigger allocations and frees. For example, when we trigger an arbitrary free while executing on CPU0, it might very well be impossible to reclaim the freed slot by spraying objects from another CPU. That is since the freed slot might end up on the freelist of a slab that is private to CPU0. Fortunately, the kernel lets a process choose the set of CPUs it would like to run on and will be making heavy use of this during our exploit [18].
Secondly, we would like to minimize unexpected allocations, i.e., changes to the allocator state that we cannot predict. There are several sources of unexpected allocations, only some of which we can control.
The first category are allocations that are directly caused by our exploit process. For instance, due to system calls or exceptions that we trigger. This is one reason we are using a low-level systems language, C in this case, for writing our exploit program. Doing this gives us a high degree of control over the allocations the kernel performs in the context of our process. One might ask why we do not use a high-level language like Python or Java Script for writing the exploit, and one reason is that here the language runtime would introduce too much noise in the form of unexpected allocations. To further minimize changes to the CPU’s allocator state, we can perform actions that inevitably cause unwanted allocations, like spawning threads or new processes, on another CPU.
The second category are allocations caused by other processes that we are sharing the CPU with. For example, suppose that we start our exploit by allocating a vulnerable object (Note: that being the lingo for an object that “contains” a vulnerability such as an out-of-bounds memory write). Then, our process gets scheduled out, i.e., another process gets to run on the CPU, before we can allocate the victim object (Note: that being the lingo for an object that we would like to “attack” with the vulnerable object, e.g., by overwriting some pointer inside it). The other process might then cause lots of allocations that fill up the slab containing the vulnerable object, shattering our dreams of causing a successful memory corruption once we get the CPU back. To mitigate this risk, we can exploit the fact that the kernel tries to spread load evenly across CPUs and that we can split tasks between independent streams of execution [19]. For example, by spraying the victim object from many treads pinned to the same CPU, recall that threads are scheduled independently of each other, we can increase the chance of a successful exploit. In case our main thread gets scheduled out, another thread of ours might get the CPU and successfully allocates the victim object. Furthermore, we can fill the CPUs run queue, that being the list of processes that the scheduler can choose from on a context switch, with processes that yield the CPU in a loop. Yielding means that the task requests to be moved to the back of the run queue. The goal of this exercise is to force the load-balancer to migrate unrelated tasks to other CPUs while maximizing the CPU time of our exploit process. Yet another technique to mitigate the risk of losing the CPU at an inconvenient moment is to measure the time our process spends on and off the CPU before we begin a critical section, i.e., a code segment during which we do not want to have the CPU taken away from us. By performing those measurements, we can begin the critical section directly after we got the CPU back from some other process. The underlying assumption here is that the likelihood of losing the CPU during some next infinitesimal time interval increases monotonically with the time that we have already had it. Different scheduling classes, scheduling priorities, scheduling parameter, interrupts, preemption, system load, ect. make the exact functional dependence non-trivial and certainly, non-constant, but to me the general assumption still seems justified. However, it would surely be worthwhile to perform some measurements to evaluate those techniques.
The third category are frees of objects in one of our CPU’s partially filled slabs that happen on a foreign CPU. This can be mitigated against by filling all partial slabs prior to exploitation (see below). Foreign CPUs will now free objects in full slabs, which results in the now partial slab being moved to their partial list.
The last category are allocations that are happening during interrupts. To the best of my knowledge, there is not much we can do about them.
In the previous section, we already mentioned that the allocation size is not the only parameter that influences which cache serves an allocation request. For example, depending on the kernel version and configuration, reclaiming the slot of an object that was allocated by a call to kmalloc with GFP_KERNEL_ACCOUNT by spraying objects that have the same size but are allocated with GFP_KERNEL is a hopeless ordeal. This is since the objects are allocated in different caches. In general, this problem can be overcome by draining the slab, which, as you maybe recall, causes it to be destroyed and handed back to the page allocator, and then re-using the very same memory for a slab in another cache. (Note: The page allocator, also known as the Buddy Allocator, is used by the kernel to allocate one or more pages of contiguous memory). I other cases it might be viable to “spray slabs” to create a memory layout where slabs belonging to different caches are adjacent. This can then be used to perform cross cache overflows or to exploit partial pointer overwrites.
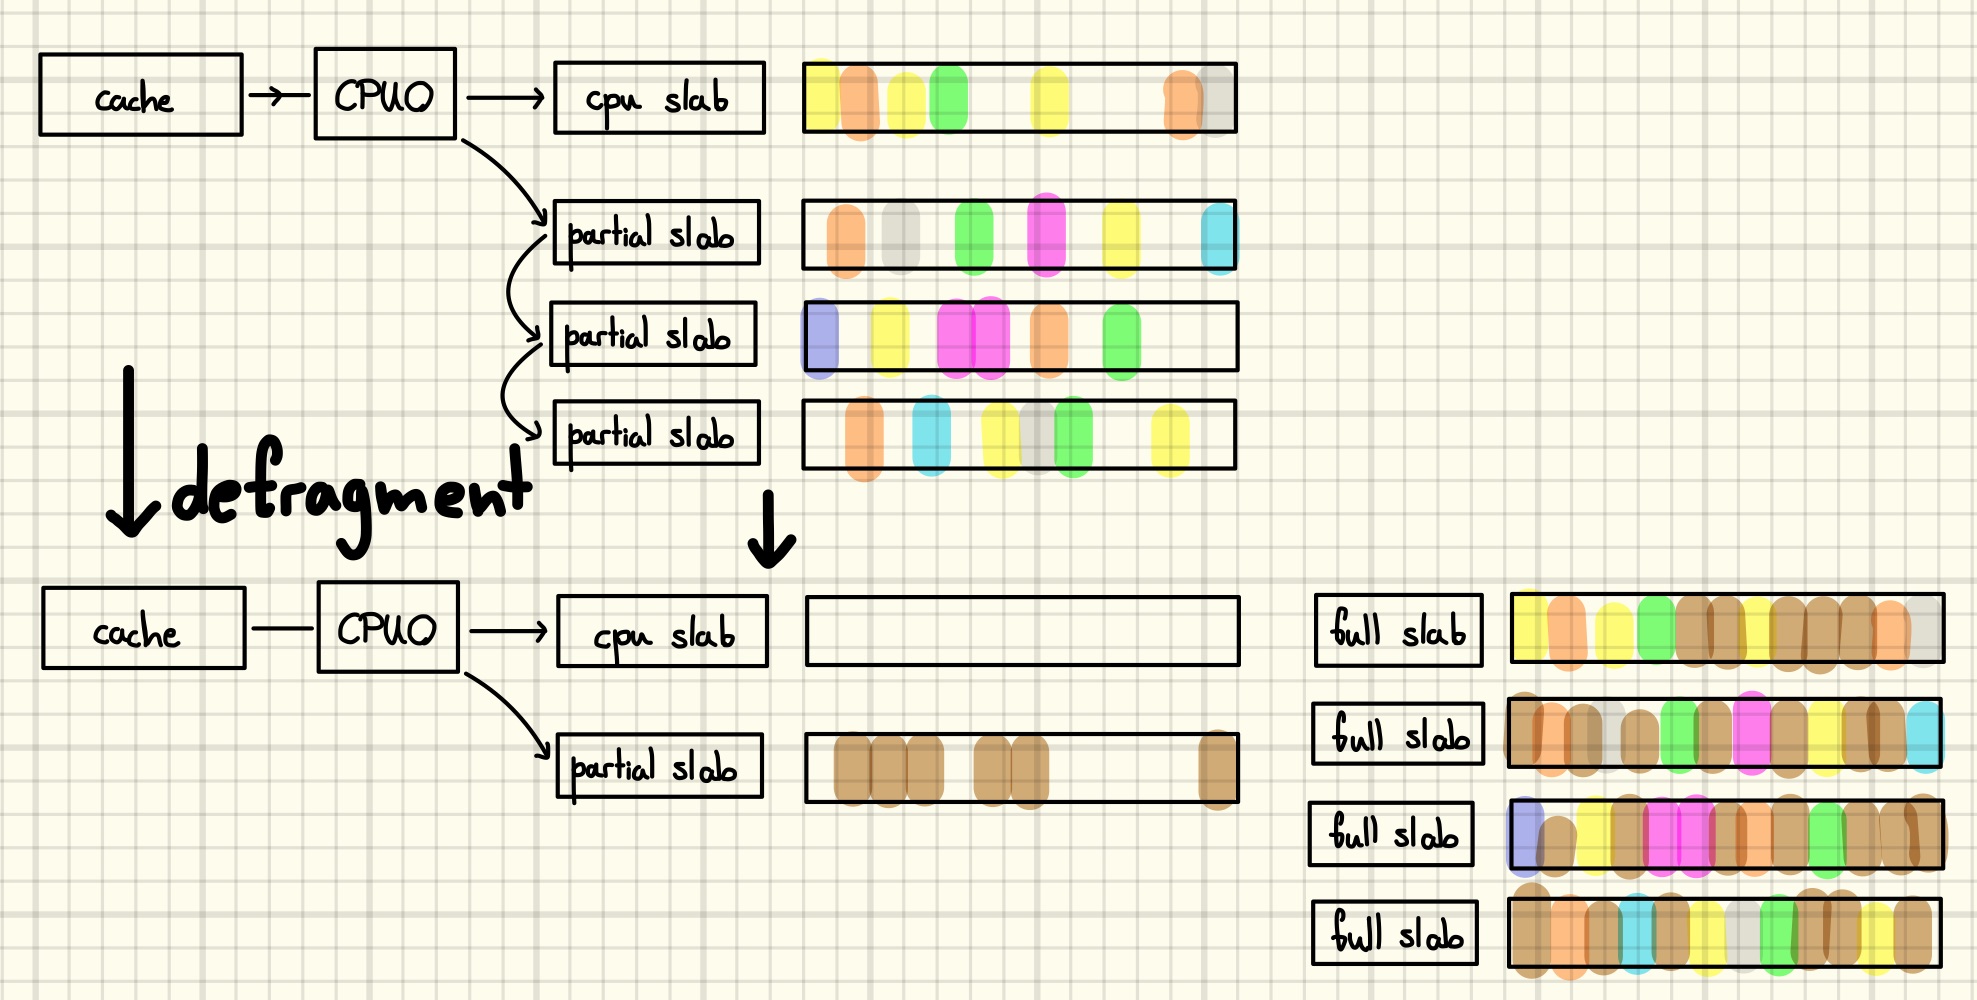
Finally, there is the problem posed by an unknown allocator state, i.e., number, fill status and object composition of existing per-CPU and per-node slabs when we start our exploit. We can normalize the heap state by performing a large number of allocations, followed by freeing a slab worth of them to force a state where there is an empty CPU slab and a single partial slab. In the literature this technique is often called defragmentation and I tried to illustrate its effect in the following drawing.
However, being able to create an allocator state with an empty CPU slab does not imply that is is trivial to control the relative positioning of vulnerable and victim object allocations. One reason why this is still hard is due to the randomization of the order in which the slots of the slab are handed out by the allocator. To successfully exploit an out-of-bounds write, for example, one can try to allocate the vulnerable object in a slab that’s otherwise filled with victim objects. If the vulnerable object offers an out-of-bounds read, or other information leak primitives, they might as well be used to defeat the mitigation.
Of course I can not, and probably should not attempt to, give a comprehensive overview of heap exploitation and exploit stabilization techniques at this point. I tried to focus on the things that will become relevant in the exploit we discuss below, but there is a lot more one could say about the topic. For example, you could read about cross cache attacks [20] [21], attacking the implementation [22] or completely re-purposing the slab’s pages [23]. This recent paper by Kyle et al. might also be a good starting point [24].
Constructing an Arbitrary Free Primitive
Recall that the bug is essentially giving us the following primitive
filter = kmalloc(4096, GFP_KERNEL_ACCOUNT);
...
filter[4096] = 0;
In other words, we can write a single null byte out of bounds in a kmalloc-4k slab.
What can we do with that primitive? Of course, we can look up possible answers as there are public exploits for this challenge, but let’s nevertheless go through some ideas.
Brandon Azad of Google Project Zero defines an exploit strategy as “The low-level, vulnerability-specific method used to turn the vulnerability into a useful exploit primitive.” [25]. Our bug already gives us a useful, albeit rather weak, primitive. Thus, what we need is an exploit technique, i.e., “A reusable and reasonably generic strategy for turning one exploit primitive into another (usually more useful) exploit primitive.”. We can gather ideas for possible exploit techniques by looking at public exploits that had similar primitives, a good starting point would be Google’s Kernel Exploits Recipes Notebook [26], but there is probability no way around reading lots of blog posts.
One idea would be to corrupt the reference count of an adjacent victim object. Many kernel objects have a field that keeps track of the number of entities that are using the object. When some entity releases its reference, it is checked whether they were the last one holding on to the object, and in that case, the object will be destroyed. Thus, by using our corruption primitive to decrement a refcount we could maybe cause a use-after-free over some victim object.
Another idea would be to corrupt the flags of an object, causing it to be handled in an unexpected manner. Yet another common ansatz would be to corrupt a length field in some victim structure to subsequently exploit flawed bounds checks on the corresponding buffer. However, the latter idea suffers from the fact that our primitive can only ever decrease a value, which is maybe not what we want to do with a length.
While all those ideas might very well work, we will go with another typical target of partial overwrites: pointers. Roughly speaking, there are three kinds of pointers that might be present in a victim structure: function pointers, data pointers, or linked list pointers. But how do find objects that have an interesting pointer as the first member?
Since we compiled the kernel with debugging information we can use the pahole tool to list kernel structs. (The –E expands embedded structs and typedefs, whereas the other two commands generate lists of object sizes and variable-size objects, respectively.)
$ pahole --structs -E vmlinux > /tmp/pahole_vmlinux_E
$ pahole -s vmlinux > /tmp/pahole_vmlinux_s
$ pahole --with_flexible_array vmlinux > /tmp/pahole_vmlinux_flex
From now on, which kinds of queries we can make against the set of kernel objects is only limited by our command over the chaining of core UNIX utilities. For example, we can generate a list of the 5 biggest structs that start with a function pointer.
sm_metadata 25200
sm_disk 8752
e1000_mac_info 768
poll_wqueues 560
net_device_ops 560
However, upon closer inspection, none of those objects looks like it can be allocated in kmalloc-4k. Generating the list of all structs that start with a function pointer and have a flexible array member yields the following set
ahash_request_priv
ff_device
pci_packet
pm_clk_notifier_block
Qdisc
Again, none of those structures looks like we can control its allocation in kmalloc-4k, and even if we could, it is questionable whether the partial overwrite of the function pointer would be of any use.
Using a memory corruption primitive for attacking linked lists has an awfully long history in exploitation. For example, TheFlow used a two null byte OOB write to corrupt the list linking messages in a POSIX message queue [27]. While we cannot use this technique due to our container’s seccomp filter, we will go with the general idea.
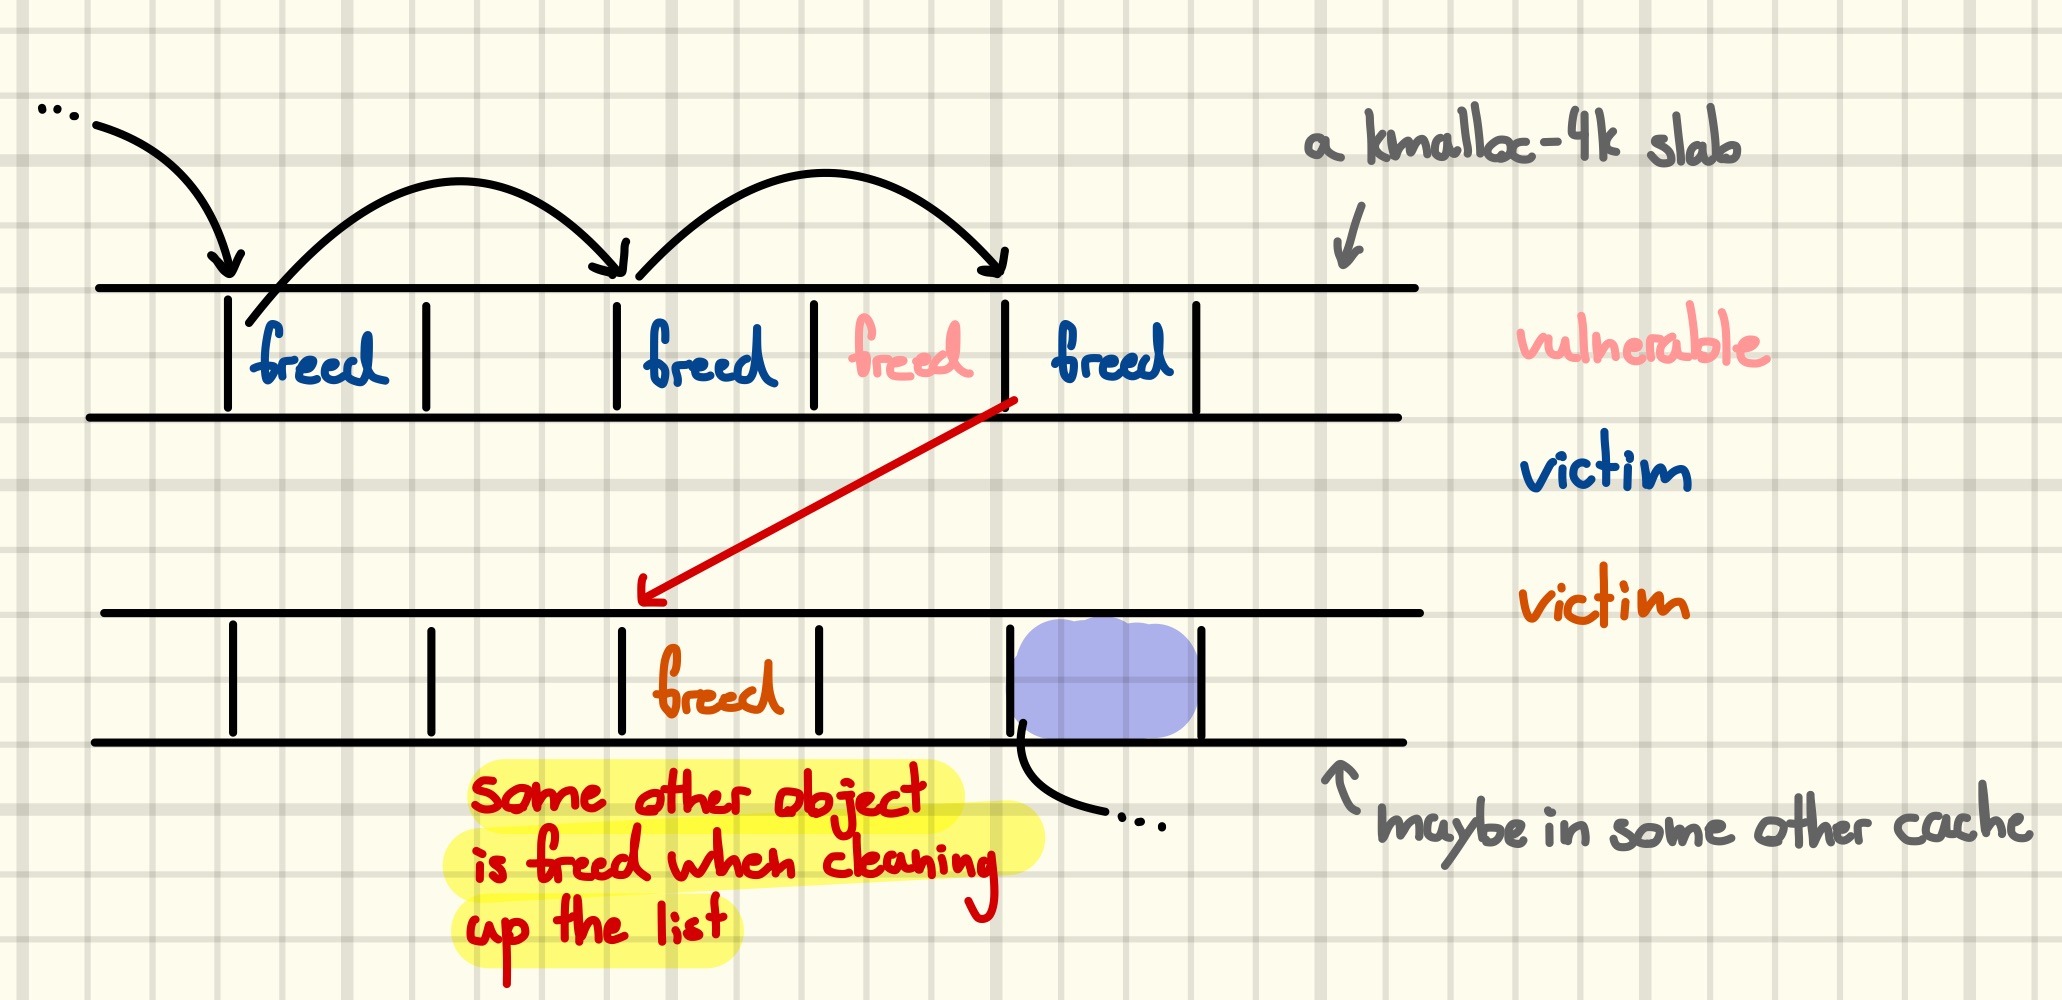
One idea to exploit the fact that some object is know unknowingly part of the list is to trigger a clean up of the list to arbitrarily free the object. In pictures, this means turning
 into
into
We can try to identify structs that are potentially chained in such a way by generating a list of all structs that start with a member of type “pointer-to-own-struct-type”. Again, there is no object with a size that could end up in kmalloc-4k, but filtering for flexible array members yields a somewhat short list.
bio
hpets
mmu_gather_batch
neighbour
nh_group
pneigh_entry
poll_list
poll_table_page
sched_domain
sched_group
(Note: You might wonder why the above-mentioned messages are not appearing in this list. This is since they linked using the kernels list management api, the stuct list_head to be concrete. Including those is left as an exercise for the reader.)
Identifying some struct that looks like it might be a suitable victim object is good, however, we still need to verify that we are able to reliably allocate it next to the vulnerable object. Furthermore, the way in which the object is used after the corruption must provide us with a useful exploitation primitive without endangering system stability.
It would be interesting to develop a more sophisticated solution that allows for more complex queries against the set of kernel structures. Combining it with compile-time static analysis for finding allocation sites and run-time tracing to identify reaching code paths could improve the seemingly very manual process of victim object discovery.
The above list already includes our victim-of-choice, the poll_list. It was discovered by the challenge author, and it seems likely the challenge was designed with that abject in mind.
By reading its man page we can learn that the poll system call allows a process to pass the kernel a table whose rows consist of a file descriptor and a list of events that might occur on it [28]. When one of those events occurs, the system call will return, and the third column will indicate which events occurred. Imagine, for example, a single threaded asynchronous server that has many open connections to clients, each represented by a file descriptor. The server may then serve all those clients by using poll to get notified when new data arrives on any of those connections. The other parameter of the poll system call is the timeout in milliseconds before it will unconditionally return.
Internally, the kernel saves the table in a singly linked list of poll_list objects. The first few rows are saved on the kernel stack as a performance optimization {1}, while the rest is split into chunks of 510 rows {2}, which are allocated in kmalloc-4k {3}. The last, potentially smaller, chunk might end up in another cache, kmalloc-32 in our case.
static int do_sys_poll(struct pollfd __user *ufds, unsigned int nfds,
		struct timespec64 *end_time)
{
	struct poll_wqueues table;
	int err = -EFAULT, fdcount, len;
	/* Allocate small arguments on the stack to save memory and be
	   faster - use long to make sure the buffer is aligned properly
	   on 64 bit archs to avoid unaligned access */
	long stack_pps[POLL_STACK_ALLOC/sizeof(long)]; // {1}
	struct poll_list *const head = (struct poll_list *)stack_pps;
 	struct poll_list *walk = head;
 	unsigned long todo = nfds;

	if (nfds > rlimit(RLIMIT_NOFILE))
		return -EINVAL;

	len = min_t(unsigned int, nfds, N_STACK_PPS);
	for (;;) {
		walk->next = NULL;
		walk->len = len;
		if (!len)
			break;

		if (copy_from_user(walk->entries, ufds + nfds-todo,
					sizeof(struct pollfd) * walk->len))
			goto out_fds;

		todo -= walk->len;
		if (!todo)
			break;

		len = min(todo, POLLFD_PER_PAGE); // {2}
		walk = walk->next = kmalloc(struct_size(walk, entries, len),
					    GFP_KERNEL); // {3}
		if (!walk) {
			err = -ENOMEM;
			goto out_fds;
		}
	}

	poll_initwait(&table);
	fdcount = do_poll(head, &table, end_time); // {4}
	poll_freewait(&table);

	if (!user_write_access_begin(ufds, nfds * sizeof(*ufds)))
		goto out_fds;

	for (walk = head; walk; walk = walk->next) { // {5}
		struct pollfd *fds = walk->entries;
		int j;

		for (j = walk->len; j; fds++, ufds++, j--)
			unsafe_put_user(fds->revents, &ufds->revents, Efault);
  	}
	user_write_access_end();

	err = fdcount;
out_fds:
	walk = head->next;
	while (walk) { // {6}
		struct poll_list *pos = walk;
		walk = walk->next;
		kfree(pos);
	}

	return err;

Efault:
	user_write_access_end();
	err = -EFAULT;
	goto out_fds;
}
Afterwards, the kernel will periodically check on all the file descriptors in the call to do_poll {4}. When a requested event occurs, or the timeout fires, the call returns, and the kernel will walk through the list and copy the occurred events back to user space {5}, freeing the list of poll_list objects afterwards {6}.
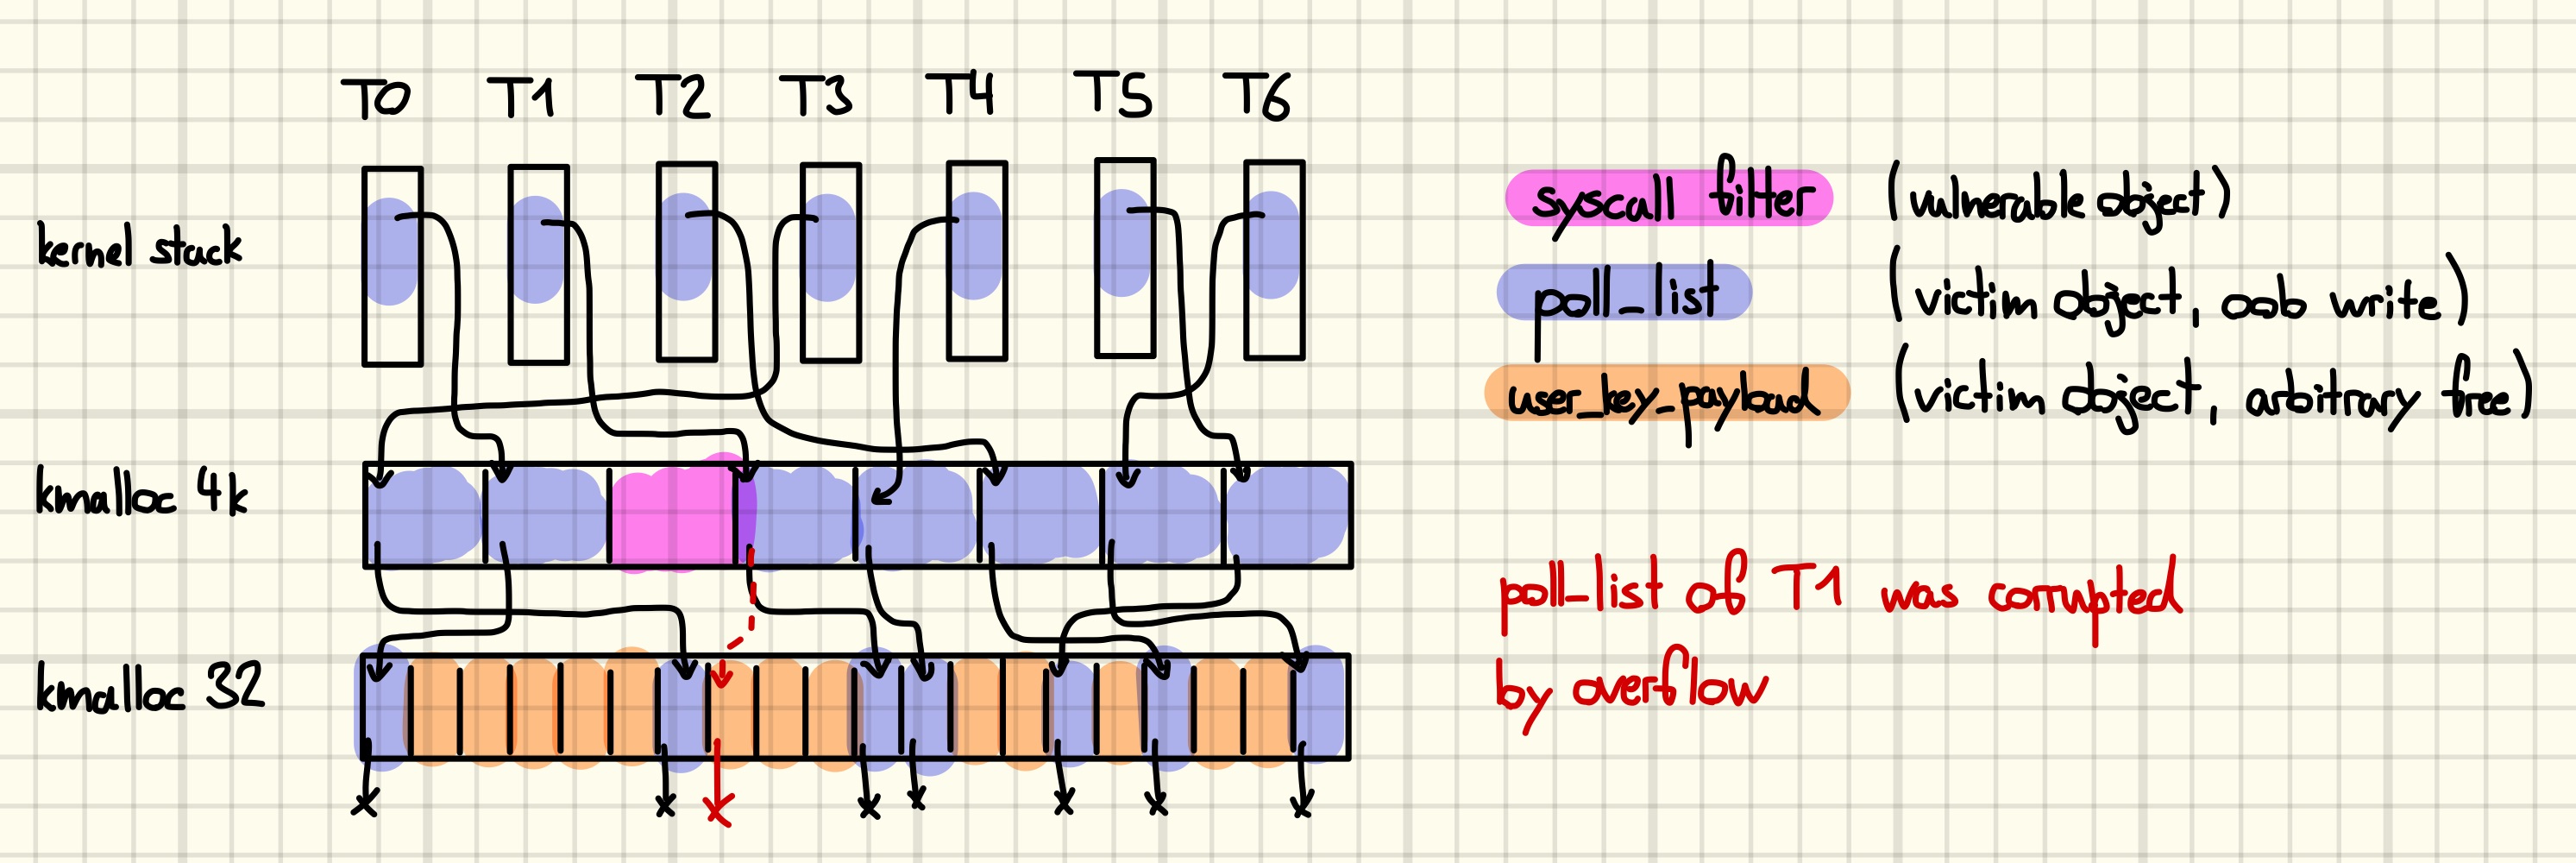
The number of objects in a kmalloc-4k slab on our target system is eight. Consequently, the ideal memory layout for exploiting our off-by-null bug would be to have seven victim poll_list objects and one vulnerable syscall filter object in the same slab.
Then, there is a 7/8 probability of writing to a next pointer of a poll_list, with a chance that the remaining cases write to unused memory after the slab and thus maybe do not cause a kernel crash.
There’s another 7/8 chance that we actually corrupt the next pointer, with the other cases being ones where it already ends in a null byte. Those are also retryable.
If we manage to trigger a corruption, we would like to maximize the probably that the corrupted pointer now points to a victim object. Consequently, we would like 121 of the 128 objects in the kmalloc-32 slab to be victim objects, with the other seven objects being the next poll_list objects. Therefore, assuming that the pointer was corrupted, there is a 121/127 chance that it now points to a victim object, with the other cases being the ones where it points to another poll_list. While the double-free that occurs in the latter case is very likely to lead to a kernel crash down the road, an overall best-case 121/127 probability of a successful arbitrary free is not too bad. (Best-case as there are rare occasions where other effects interfere with our allocations, c.f., the above discussion.)
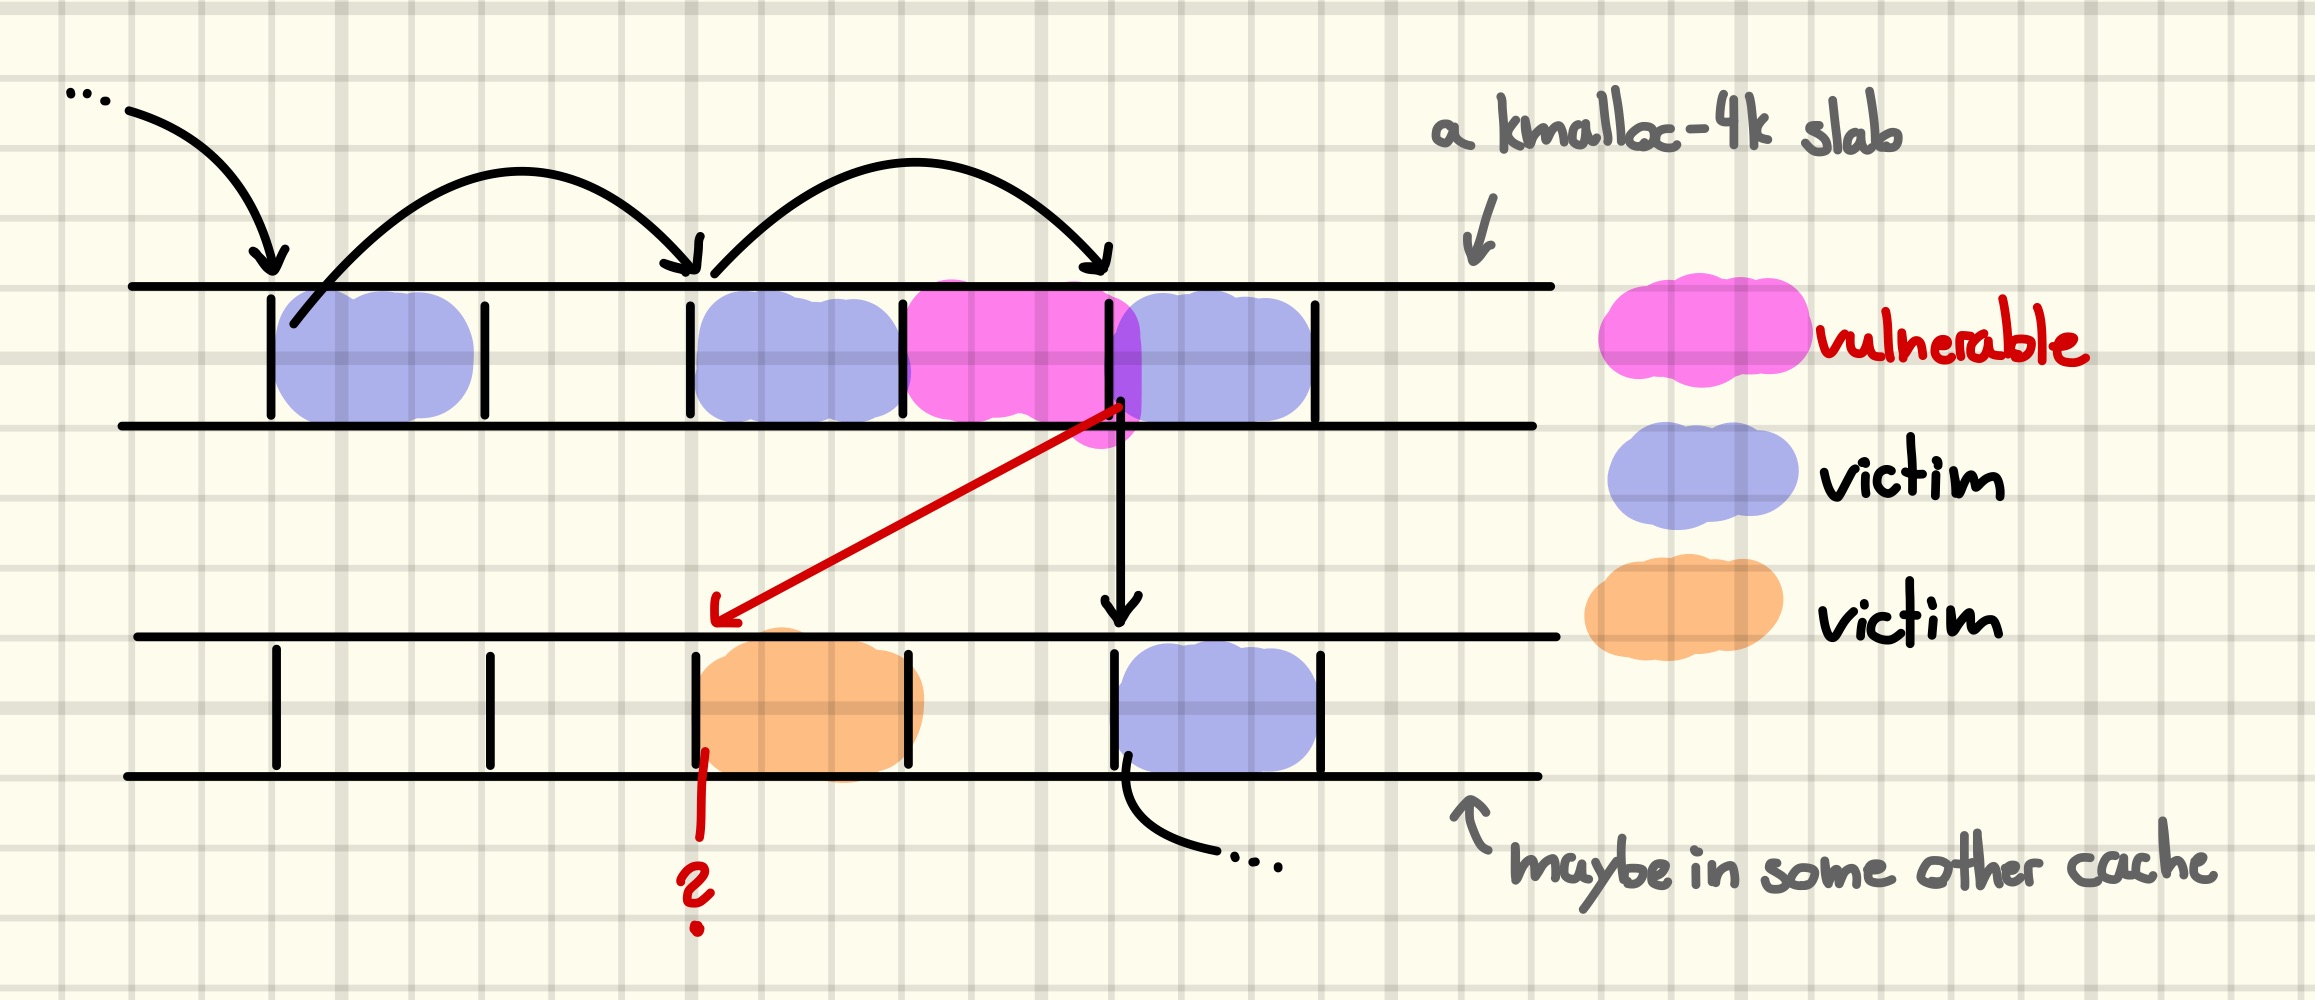
The following drawing illustrates the desired memory layout.
 By corrupting the next pointer of the second-to-last node in a singly linked list of
 poll_list objects we include an unsuspecting victim object in the list. Returning from the system call triggers the list cleanup and arbitrarily frees the victim object.
Exploiting the Arbitrary Free
In theory, we now know how to turn our OOB write into an arbitrary free primitive. However, we still need to implement and execute it. Furthermore, there remains the open question of: what is it that we want to free?
Since our partial override can only divert the next pointer to an object in the same slab as the original one, the victim must live in kmalloc-32 as well. Luckily for us, there exists previous research on victim objects, which also considered where they can be allocated [29], [30]. They already identified user_key_payload as an object with some pleasant properties. For some background on the in-kernel key management and retention facility, see [31].
struct user_key_payload {
	struct callback_head {
		struct callback_head * next;                                             /*     0     8 */
		void               (*func)(struct callback_head *);                      /*     8     8 */
	}rcu; /*     0    16 */
	short unsigned int         datalen;                                              /*    16     2 */

	/* XXX 6 bytes hole, try to pack */

	char                       data[];                                               /*    24     0 */

	/* size: 24, cachelines: 1, members: 3 */
	/* sum members: 18, holes: 1, sum holes: 6 */
	/* last cacheline: 24 bytes */
};
The struct is a simple container for user-supplied data, where the length of the data is stored alongside it in the datalen field. Crucially, the kernel will consult this length field when copying the data back to user space [32]. Thus, by aiming our arbitrary free at this object we can easily create an information leak from the resulting use-after-free. At this point, the attentive reader might spot a potential problem. Recall how the kernel cleans up the poll_list:
while (walk) {
	struct poll_list *pos = walk;
	walk = walk->next;
	kfree(pos);
}
i.e., we potentially jeopardize system stability if the first QWORD of the victim object is not under our control. This is where the second useful property of user_key_payload becomes important: its first two QWORDs are not initialized on allocation. However, this only leads us to the next problem: how to initialize them?
Back in 2018 Vitaly Nikolenko invented the “universal heap spray” that, in essence, allowed the allocation of an arbitrary amount of data in arbitrary caches [33]. One part of the technique involved the observation that the setxattr system call essentially makes an allocation with a user-controlled size and then fills it with user-controlled data [34] [35]. The problem with heap spraying, however, is that the buffer is freed when the syscall returns. In our case that is not a problem at all as it provides a reliable way to initialize heap memory. In particular, by reclaiming the chunk used during the setxattr operation when allocating the key, we ensure that confusing our key for a poll_list does not cause unpredictable behavior during list cleanup. To speed up this preparatory step, we can make the copy_from_user operation fail at the last byte, e.g., by letting it run into unmapped memory, to skip the rest of the syscall.
To create the memory layout sketched above, we begin by normalizing the kmalloc-4k and kmalloc-32 caches as described in the section on SLUB exploitation [36]. Then, we start seven threads to allocate the poll_list objects, and another thread to allocate user_key_payload objects [37]. While using threads for polling is necessary due to the blocking nature of the system call, using threads for the keys is optional, but might reduce the chance of unexpected allocations due to the scheduling of an unrelated task. The main thread triggers the memory corruption once all poll_list objects are allocated [38].
We continue by preparing a favorable type confusion over the victim object.
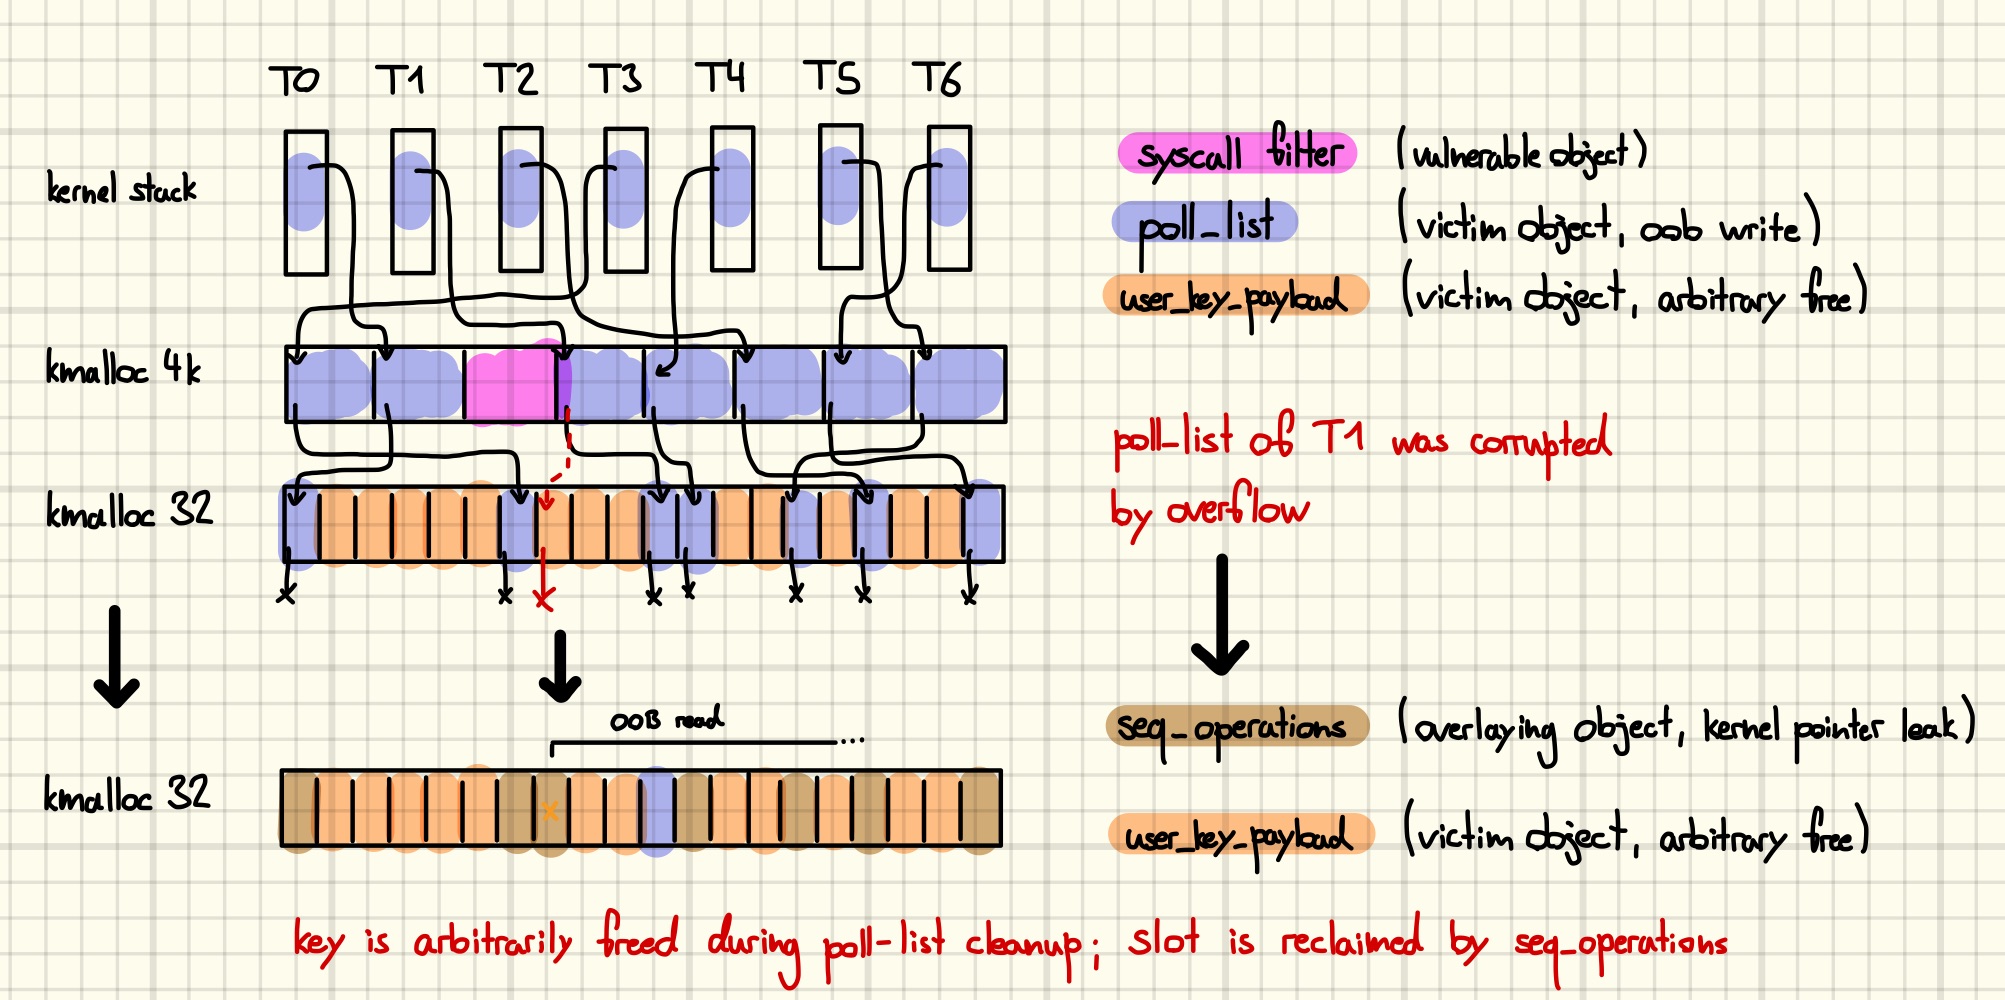 For that purpose, we allocate many
 seq_operations structs after freeing the user_key_payload. The former is a well-known struct full of kernel function pointers, that is allocated whenever single_open is called, e.g., when opening “/proc/self/stat”. As the two least significant bytes of a function pointer now corrupted the datalen of the user_key_payload, reading it back gives us a substantial chunk of kernel heap data.
Aside: One neat optimization that we can do at this point is to start spraying as soon as the corruption has happened. The thread whose poll_list was corrupted can notice the fact by priming the revents of the last two pollfd with a magic value. Usually, the kernel will overwrite them before returning.
for (walk = head; walk; walk = walk->next) {
	struct pollfd *fds = walk->entries;
	int j;

	for (j = walk->len; j; fds++, ufds++, j--)
		unsafe_put_user(fds->revents, &ufds->revents, Efault);
}
However, when confusing the user_key_payload for a poll_list the walk->entries will be zero and the magic value will remain [39].
While the function pointer leak breaks kernel address space layout randomization (KASLR) we require more leaks in order to successfully finish our exploit.
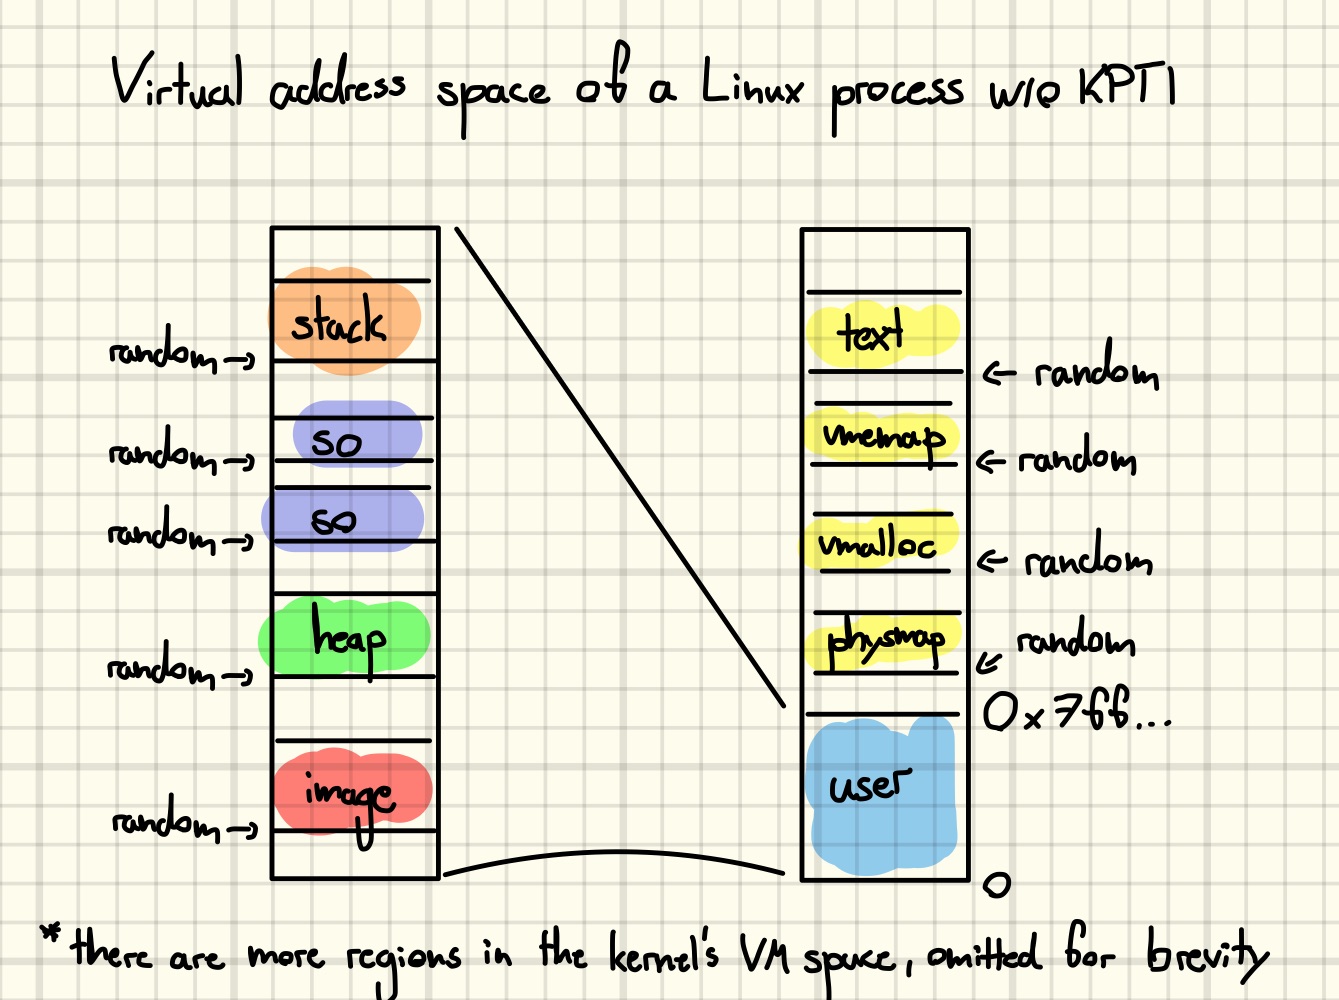 First, we would like to use our arbitrary free primitive again to cause a more powerful use-after-free, but for that to work, we need to know the address of an object to aim at. Second, the kernel image is not the only region that is affected by KASLR. There is also the kernel’s direct map and the array of
 page structures used to manage it [40]. We will make use of all those leaks later.
The good news is we can collect all those addresses in one sweep. In preparation for this step, we first free up some space in the affected slab by releasing all but the corrupted user_key_payload.
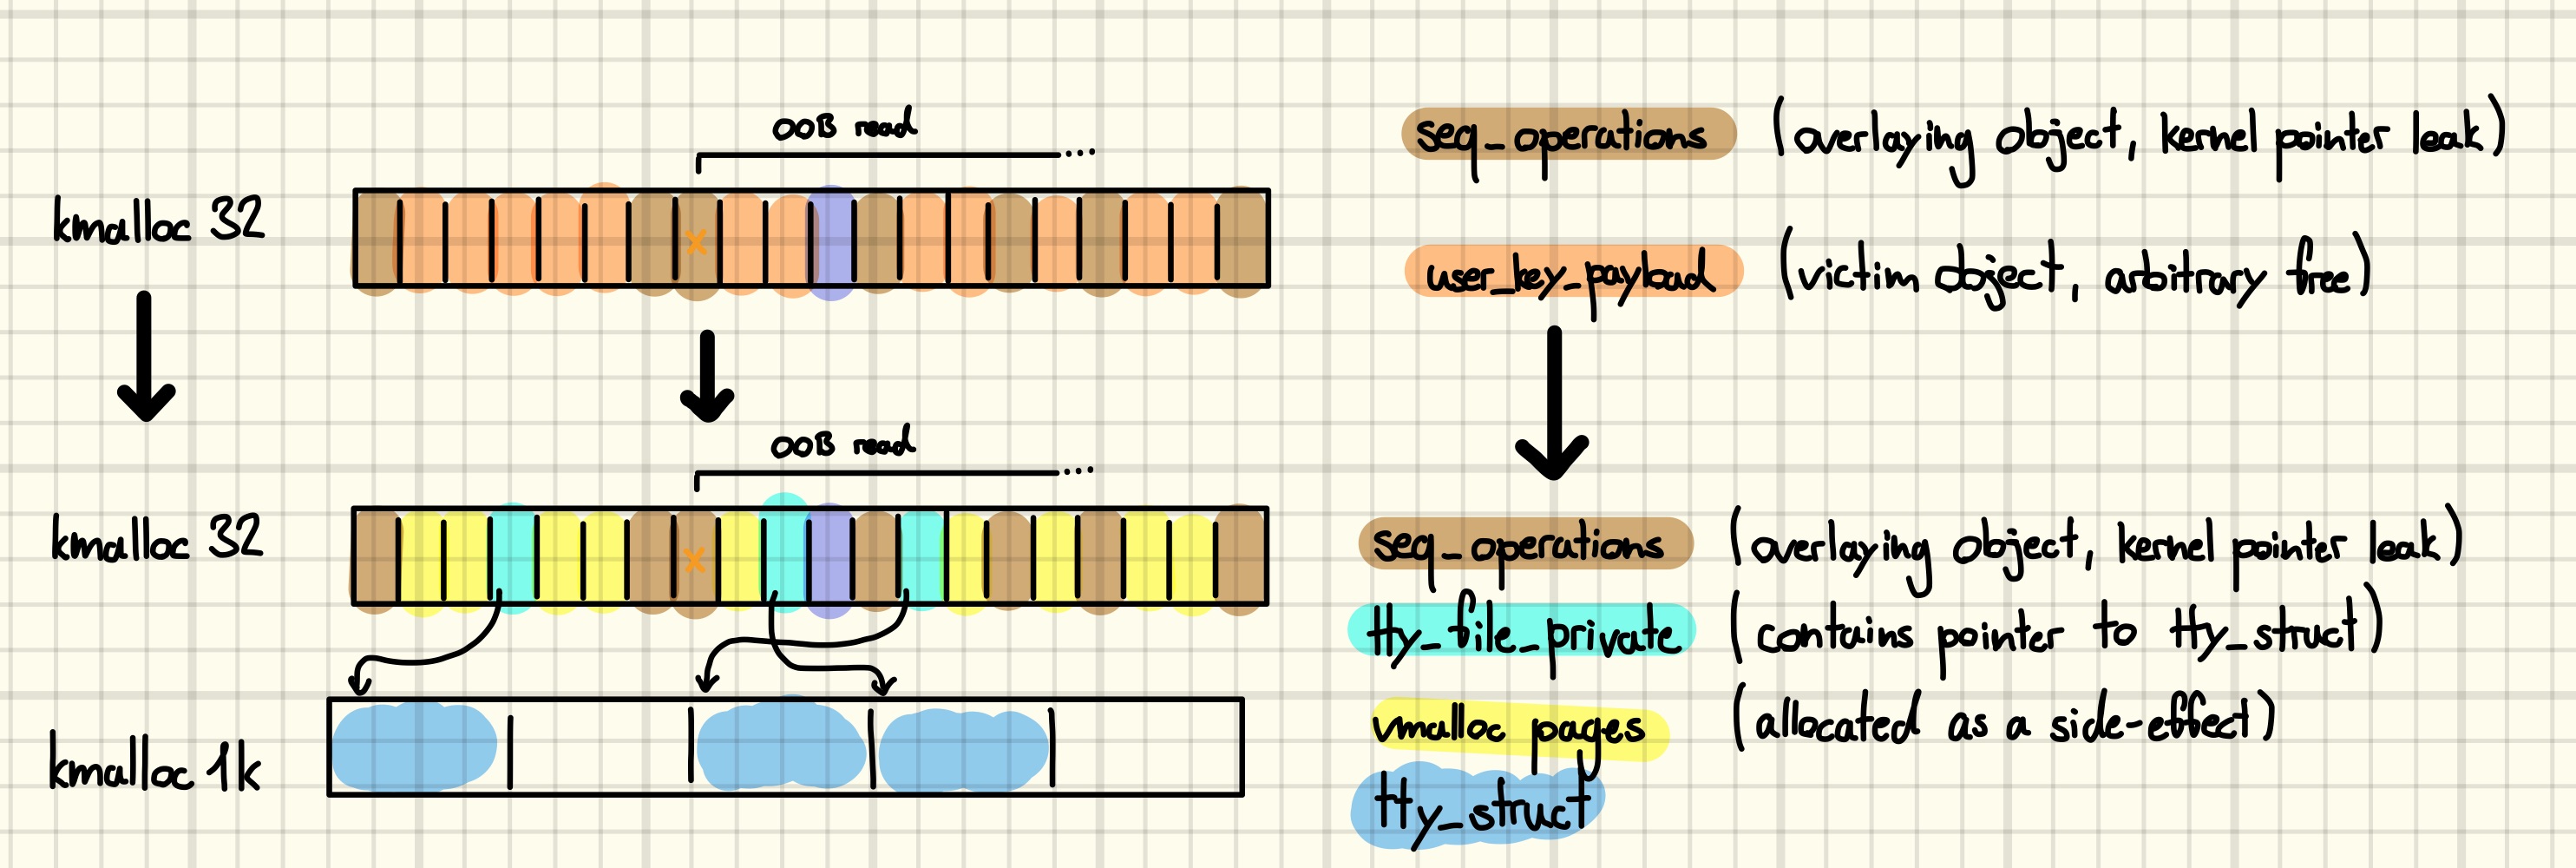 Opening a pseudo-terminal, i.e., “/dev/ptmx”, causes many allocations [41]. Two of those land in kmalloc-32 and can thus be exposed by our OOB read primitive. The first one is a
 tty_file_private, which is part of a doubly linked list hanging off the tty_struct, connecting it to all files open for it. Leaking its contents gives us the address of the tty_struct as well as a file, both of which are attractive targets for an arbitrary free [42] [43]. The second one is caused by a call to kvmalloc, which internally allocates a small buffer to hold pointers to the pages it allocated [44]. We will elaborate on the conditions under which those leaks are sufficient to deduce the base address of the respective memory regions in the next post.
Wrap Up
We started our journey by setting up an exploit development environment, which we then used to interactively explore the challenge. After that, we reverse-engineered the vulnerable driver to discover an off-by-null bug. A brief introduction to the SLUB allocator and current heap exploitation methods was needed to understand and implement the technique used to turn the bug into an arbitrary free primitive. Finally, we exploited the arbitrary free to leak the base addresses of three separately randomized kernel memory regions and two heap-allocated kernel structures.
The above-mentioned video recording contains a live debugging session with all the exploit steps discussed here. You can try it out locally by installing the kernel debugging setup and compiling the exploit repository.
In the next post, we will, step-by-step, gain stronger exploit primitives, ending up with arbitrary kernel read/write or arbitrary code execution via ROP.
References
[0] https://www.youtube.com/playlist?list=PLhixgUqwRTjwufDsT1ntgOY9yjZgg5H_t
[2] https://2022.cor.team/
[3] https://github.com/Crusaders-of-Rust/corCTF-2022-public-challenge-archive/tree/master/pwn/corjail
[4] https://syst3mfailure.io/corjail/
[5] https://github.com/0xricksanchez/like-dbg
[6] https://github.com/vobst/like-dbg-fork-public
[7] https://github.com/vobst/ctf-corjail-public
[8] https://android-developers.googleblog.com/2020/06/system-hardening-in-android-11.html
[9] https://www.llvm.org/docs/ScudoHardenedAllocator.html
[10] https://lwn.net/Articles/932201/
[11] https://en.wikipedia.org/wiki/Slab_allocation
[12] https://blogs.oracle.com/linux/post/linux-slub-allocator-internals-and-debugging-1
[13] https://events.static.linuxfound.org/sites/events/files/slides/slaballocators.pdf
[14] https://events.static.linuxfound.org/images/stories/pdf/klf2012_kim.pdf
[15] https://github.com/nccgroup/libslub
[16] https://github.com/PaoloMonti42/salt
[17] https://www.kernel.org/doc/Documentation/vm/slub.txt
[18] https://man7.org/linux/man-pages/man2/sched_setaffinity.2.html
[19] https://lwn.net/Articles/793427/
[20] https://etenal.me/archives/1825
[21] https://www.willsroot.io/2022/08/reviving-exploits-against-cred-struct.html
[22] https://grsecurity.net/how_autoslab_changes_the_memory_unsafety_game
[23] https://yanglingxi1993.github.io/dirty_pagetable/dirty_pagetable.html
[24] https://github.com/sefcom/KHeaps
[25] https://googleprojectzero.blogspot.com/2020/06/a-survey-of-recent-ios-kernel-exploits.html
[26] https://docs.google.com/document/d/1a9uUAISBzw3ur1aLQqKc5JOQLaJYiOP5pe_B4xCT1KA/edit#heading=h.nqnduhrd5gpk
[27] https://google.github.io/security-research/pocs/linux/cve-2021-22555/writeup.html
[28] https://man7.org/linux/man-pages/man2/poll.2.html
[29] https://zplin.me/papers/ELOISE.pdf
[30] https://github.com/smallkirby/kernelpwn/blob/master/structs.md#user_key_payload
[31] https://man7.org/linux/man-pages/man7/keyrings.7.html
[32] https://elixir.bootlin.com/linux/v5.10.127/source/security/keys/user_defined.c#L171
[33] https://duasynt.com/blog/linux-kernel-heap-spray
[34] https://elixir.bootlin.com/linux/v5.10.127/source/fs/xattr.c#L511
[35] https://man7.org/linux/man-pages/man7/xattr.7.html
[36] https://github.com/vobst/ctf-corjail-public/blob/1d3395b27644d79c90268ea32250953e2a3b7da3/sploit.c#L350C2-L362C18
[37] https://github.com/vobst/ctf-corjail-public/blob/1d3395b27644d79c90268ea32250953e2a3b7da3/sploit.c#L365C1-L383C1
[38] https://github.com/vobst/ctf-corjail-public/blob/1d3395b27644d79c90268ea32250953e2a3b7da3/sploit.c#L294
[39] https://github.com/vobst/ctf-corjail-public/blob/1d3395b27644d79c90268ea32250953e2a3b7da3/libexp/poll_stuff.c#L124
[40] https://www.kernel.org/doc/html/v5.10/x86/x86_64/mm.html
[41] https://elixir.bootlin.com/linux/v5.10.127/source/drivers/tty/pty.c#L811
[42] https://googleprojectzero.blogspot.com/2022/11/a-very-powerful-clipboard-samsung-in-the-wild-exploit-chain.html
[43] https://github.com/smallkirby/kernelpwn/blob/master/technique/tty_struct.md
[44] https://elixir.bootlin.com/linux/v5.10.127/source/mm/vmalloc.c#L2478